Property Details

Investment property: Loganville, GA 30052
(Click on photo for more information)

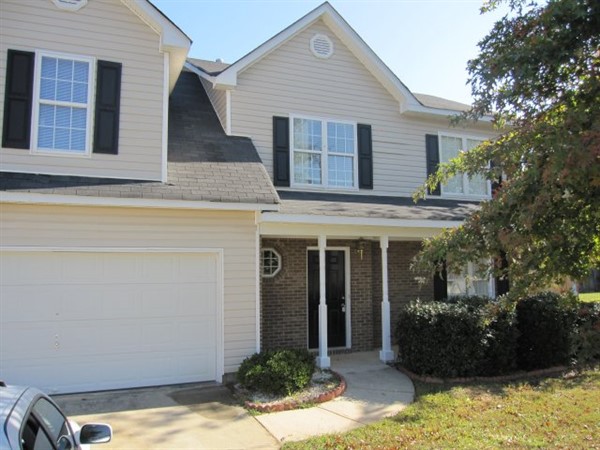
4 bedroom 2.5 bath Gwinnett County Home. Home has an open floor plan with large master suite. Home features include: breakfast nook, 2 car garage, family room, separate dining room, and a fireplace. Home sold in 2003 for $138,720 and foreclosed in 2010 for $122,948.

Address 4492 Beaverton Circle
Loganville, GA  30052
County Gwinnett
Year Built 0
Subdivision
Bedrooms 4
Bathrooms 2.5
SqFt 1631
Stories 2
Garage

Price $ 82900
Estimated Repairs $ 12000
Estimated Retail Value $ 103500
Estimated Rental Income $ 1050
Estimated Property Taxes $ 1640
HOA Fees $ 0

Get Directions To This Property >

Financial Evaluator For This Property >

Print Property Details >

Print a flyer For This Property >

Property Photos


Before

After

Comps


Address 4032 Alaina Ave
Loganville, GA 30052

3 BR / 2 BA
1512 Sq. Ft.
Last Sold On: 01/14/2011

Sales Price: $85,000

Address 229 Rockingham Drive
Loganville, GA 30052

3 BR / 2 BA
1629 Sq. Ft.
Last Sold On: 05/17/2011

Sales Price: $97,000

Address 1772 Old Loganville Road
Loganville, GA 30052

3 BR / 2 BA
1586 Sq. Ft.
Last Sold On: 04/08/2011

Sales Price: $212,000

Address 3523 Summit Creek Lane
Loganville, GA 30052

3 BR / 2 BA
1497 Sq. Ft.
Last Sold On: 01/21/2011

Sales Price: $87,600

Address 1726 Summit Creek Way
Loganville, GA 30052

3 BR / 2 BA
1521 Sq. Ft.
Last Sold On: 04/29/2011

Sales Price: $80,000


Basic Purchase Information

Estimated Property Value $
Purchase Price $
Down Payment (%) $
Equity at Purchase $

Cash at Closing

Loan Amount $
Down Payment (%) $
Closing Costs (%) $
Total Cash Required
at Closing *
$
* This total does not include potential
escrow reserves for taxes & insurance

Mortgage Calculations

Loan Amount: $, Loan Term: yrs, Interest Rate: %
Mortgage Payment $
Mortgage Payment (Yearly) $

Financial Performance Summary

Cash on Cash Return
(Year 1)
Cap Rate (Year 1)
Total Equity at Year 5 $
Projected Monthly Cash Flow $

Assumptions for Calculations (Annual)

Gross Scheduled Income (Monthly) $
Mortgage Interest Rate (%)
Mortgage Down Payment (%)
Mortgage Loan Term (Fixed)
Property Taxes $
Insurance $
Homeowners Association (Yearly) $
Property Management Fee (%)
Maintenance Reserve (%)
Appreciation Rate (%)
Vacancy Allowance (%)
Rental Income Increase (%)
Property Tax Increase (%)
Closing Costs (Purchase) (%)
Closing Costs (Sale) (%)

Cash Flow and Equity Accumulation

CASH-FLOW MONTHLY YEAR 1 YEAR 2 YEAR 3 YEAR 4 YEAR 5 YEAR 10 YEAR 20 YEAR 30
Gross Scheduled Income
Vacancy Allowance
Total Operating Income
Property Taxes
Insurance
Homeowners Association
Maintenance Reserve
Property Management
minus Total Operating Expenses
Net Operating Income
minus Mortgage Expense
GROSS CASH FLOW
Plus Principle Paydown
Plus Yearly Appreciation
EFFECTIVE NET CASH FLOW
 
EQUITY ACCUMULATION YEAR 1 YEAR 2 YEAR 3 YEAR 4 YEAR 5 YEAR 10 YEAR 20 YEAR 30
Property Value
(Mortgage Balance)
EQUITY (WEALTH)
 
TAX BENEFIT YEAR 1 YEAR 2 YEAR 3 YEAR 4 YEAR 5 YEAR 10 YEAR 20 YEAR 30
Depreciation
Mortgage Interest

Want to learn how we’ve flipped over 700 properties in Metro Atlanta?!


Register here for our upcoming free real estate investing workshop

Register

Enter your Email here to be added to our preferred buyers list


Add Me
View Our Properties Online